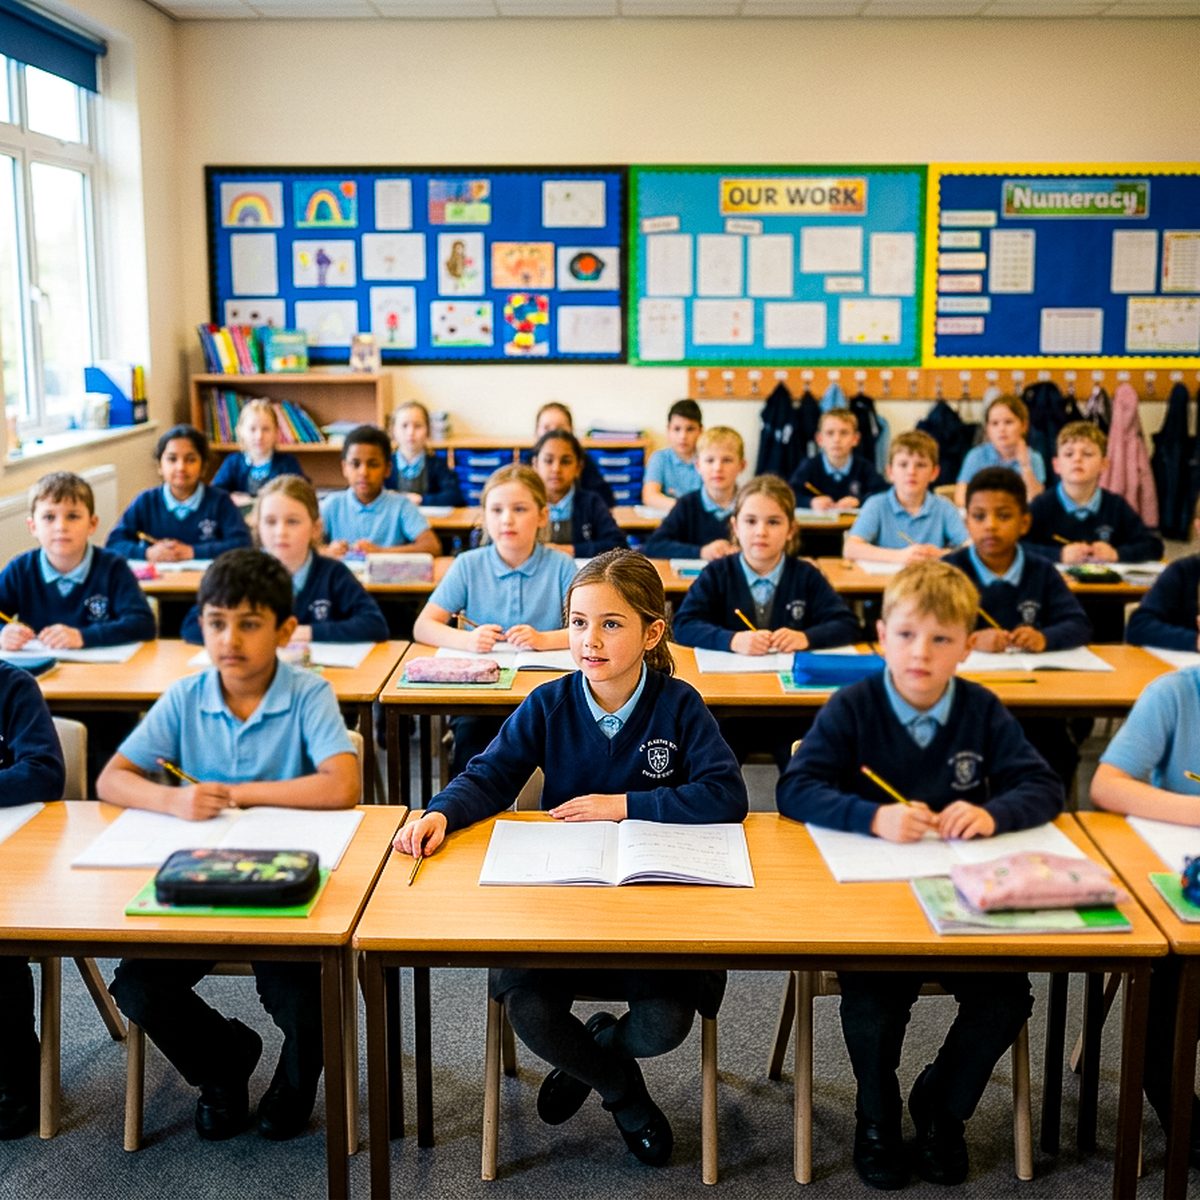


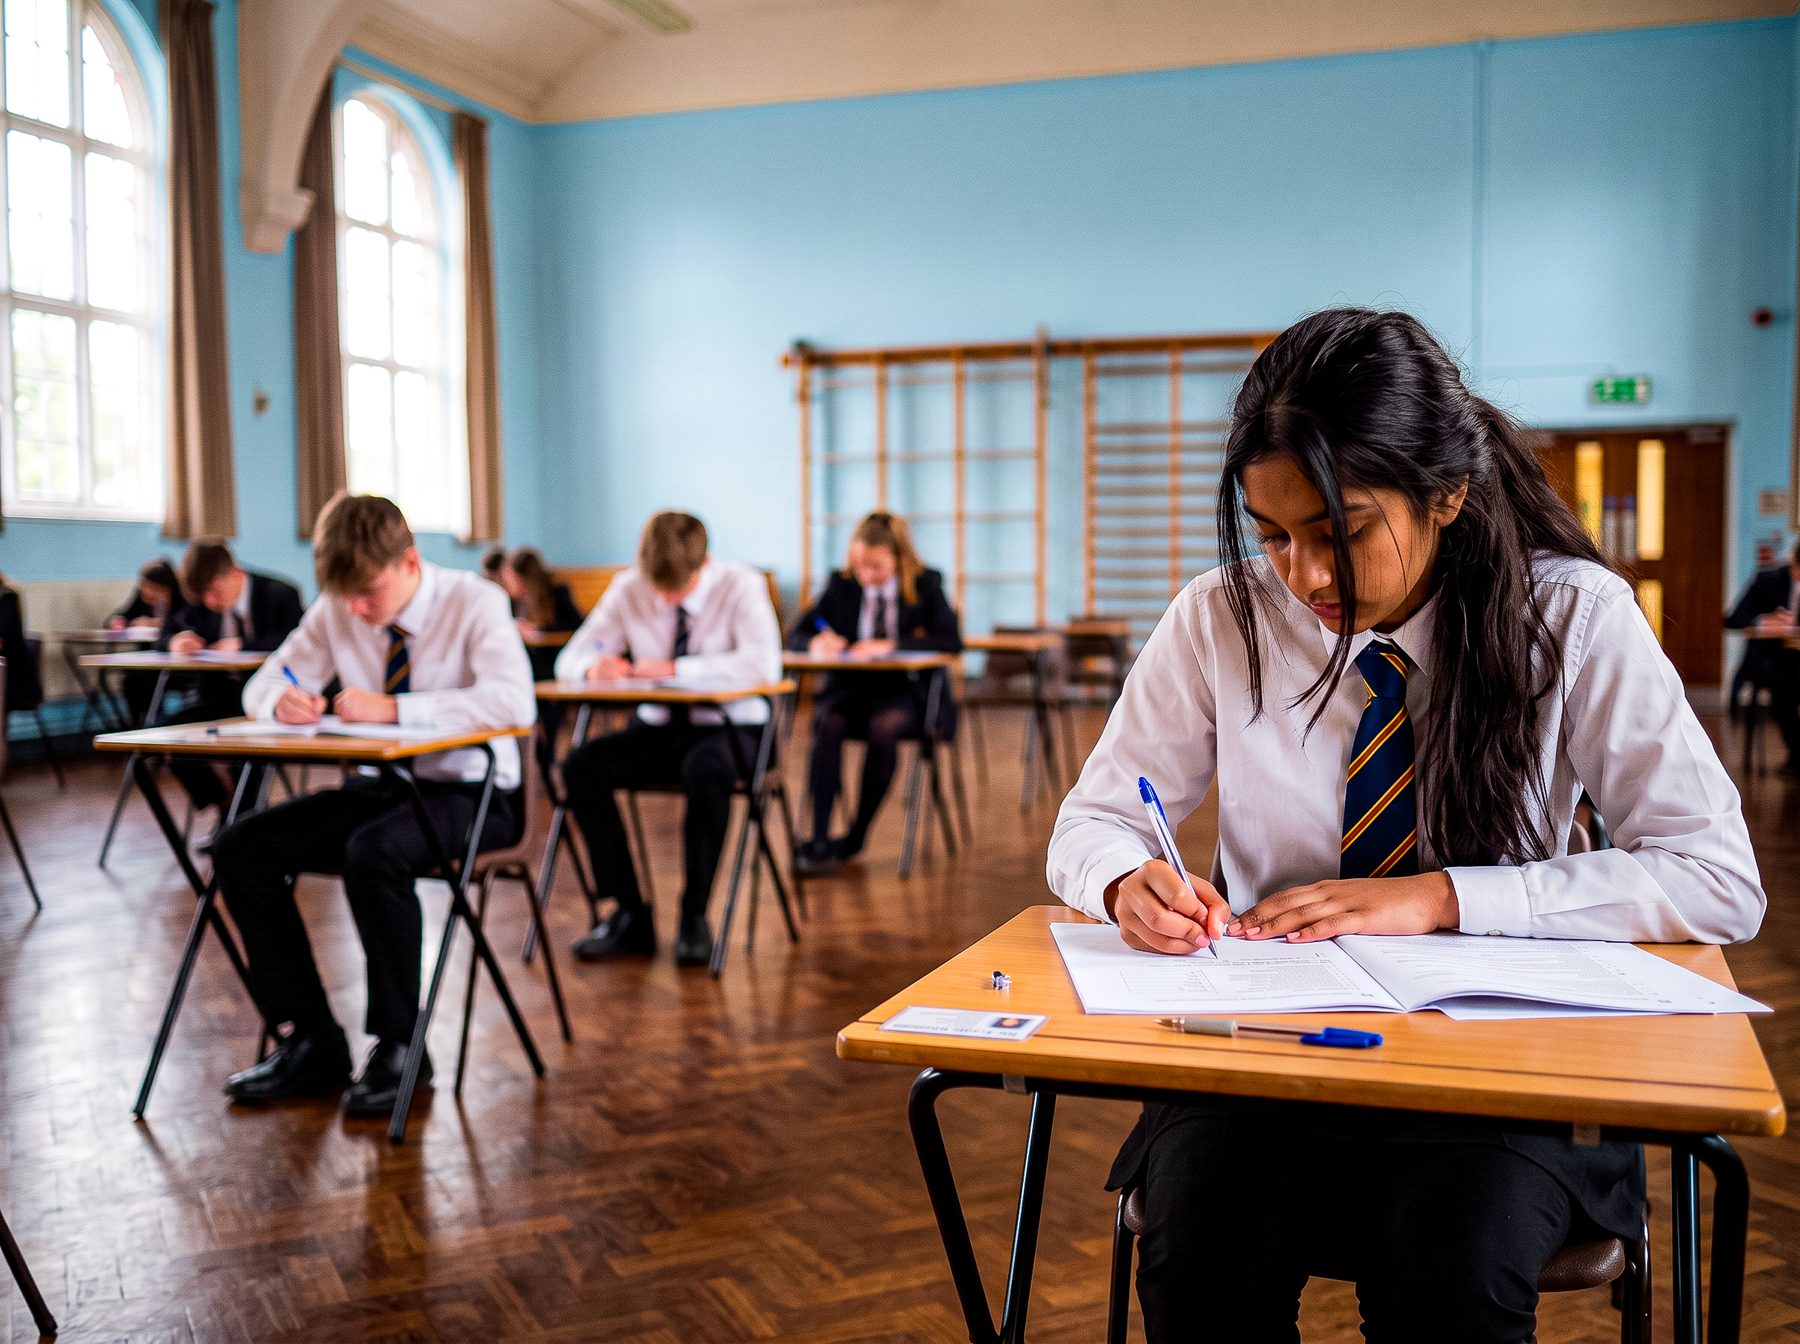
The PISA 2025 results landed on 8 September and the arguments started before most people had opened the report.
What did the four nations actually score?
The scores, for what they are worth, are: England 516 in science, 497 in reading, 492 in maths. Northern Ireland 492, 482, 473. Scotland 491, 488, 467. Wales 476, 459, 456, last of the four nations in all three, with maths down again, from 466 in 2022.
And yes, to some extent we are comparing different things. Four nations, different curriculum models, and a test that measures none of them directly. England’s own national report highlights that there is limited overlap between the National Curriculum and parts of the PISA science framework. The 2025 cohort in Wales was the last not taught under the Curriculum for Wales.
But that caveat only covers the borders. It says nothing about the trend line.
Welsh maths has fallen two cycles running. Scotland’s hasn’t recovered from 2022. England’s science is its highest in a decade, but reading and maths are still short of 2018, maths by 12 points. Same test, same country, several years apart. Those comparisons are valid, and they’re uncomfortable. Uncomfortable as a parent of two children in secondary school, as a school governor and as an EdTech CEO.
The finding almost nobody has quoted
The same survey asked pupils whether they feel they belong at school. 70.2% in the UK said yes, against an OECD average of 76.2%. Girls lower than boys. And in the UK, pupils who see the point of school outscore those who think they are wasting their time by 36 points in science, against an OECD gap of 27.
Three weeks earlier, on 19 August, the Department for Education in England published a study putting that same question, from the 2022 round, against the GCSE results that cohort went on to get. Pupils who strongly disagreed that they belong scored 7.72 points lower on Attainment 8 (England) than those who strongly agreed, which the Department itself calls almost a full GCSE grade across all eight subjects. Belonging was lowest among pupils with special educational needs, pupils eligible for free school meals, and girls.
Is wellbeing really a trade-off against standards?
That argument should be over. It was never much of an argument.
Wellbeing isn’t the soft option you get to once results are safe. It sits before, during and within results, and it’s weakest for the children already furthest behind. High standards and wellbeing aren’t in competition. Trade one for the other and you lose both.
What can a school do with this on a Monday morning?
Attainment 8 is an English measure, and every nation has built its own. Wales has Capped 9, alongside separate literacy, numeracy and science measures. Scotland counts tariff points across National 5 and Higher. Northern Ireland has its own again. Each was designed to answer the question that nation decided mattered, and each shows you something different about the ‘same’ pupil.
Which is fine, until you try to compare any of it. In most schools the attainment data sits in one system, attendance in another, behaviour in a third, and the pastoral picture is in a spreadsheet somebody keeps on their own laptop. Knowing that belonging matters and being able to see it next to a Capped 9, or equivalent score are two different problems.
That’s what we built GroupEd to do. One record per pupil, holding attainment, attendance, behaviour and the pastoral picture together. Your nation’s measures ready to run rather than rebuilt every year, whether that’s Attainment 8, Capped 9 or a tariff point score. And the measures you have decided matter yourself, sitting alongside them, because a school should be able to look at reading age against attendance against a pastoral flag without asking a software company for permission.
Not four exports and a weekend of spreadsheet work. The report you need, at the point the question occurs to you.
What software can and cannot do
None of which fixes a PISA score. Curriculum, teacher supply, funding, deprivation and the years of disruption behind this cohort all matter more than any software will.
What software can do is stop a headteacher fighting their own systems to understand their own pupils.
The next few weeks will be spent explaining these results. They’d be better spent using them.
If you’ve read the coverage this week and recognised your own school in it, tell us what you’re trying to measure and where your current system gets in the way. We’d rather hear that than run you a demonstration.
Figures from the OECD’s PISA 2025 Results (Volume I) and Education GPS, Senedd Research, the PISA 2025 national report for England, and the Department for Education’s School belonging and attainment at key stage 4 linked data study, 19 August 2026.